
In CKD, the More Acid You Eat, the More Phosphorus You Excrete

Conceptual model demonstrating hypothesized relationships. Figure S1 from Khairallah et al, AJKD © National Kidney Foundation.
In a recent AJKD article, Khairallah et al presented a prospective cohort of 980 patients with CKD enrolled in CRIC and demonstrated that higher acid load and acidosis was associated with higher serum phosphorus levels and increased phosphaturia independent of renal function, demographics, and other comorbidities. This effect did not correlate consistently with levels of FGF-23 or PTH.
To maintain homeostasis, it is of critical importance that acid-base balance is preserved. Several buffering systems exist to maintain a constant pH. In health, the primary response to an acid load is excretion of excess protons as ammonium derived from the deamination of glutamine in proximal tubular cells. Acid is also excreted in the urine as titratable acid, principally phosphates. Net acid excretion (NAE) is defined as the sum of titratable acids and urinary ammonium minus urinary bicarbonate.

Estimated acid-producing potential of selected foods. Potential renal acid load (PRAL) of selected food items (per 100-g serving) is adapted from estimates performed by Remer and Manz and calculated as PRAL (mEq/d) = 0.49 × protein (g/d) + 0.037 × P (mg/d) − 0.021 × K (mg/d) − 0.026 × Mg (mg/d) − 0.013 × Ca (mg/d). Figure 1 from Scialla and Anderson, ACKD © National Kidney Foundation.
The acid load in the diet is governed by intake and absorption of inorganic anions relative to inorganic cations, and the oxidation of sulfur-containing amino acids in the liver. Using data on food composition and intestinal absorption from published literature, it is possible to estimate the amount of acid derived from the diet, or Potential Renal Acid Load (PRAL), which is approximated from dietary recall and has shown to be predictive of NAE.
In chronic kidney disease (CKD), increasing proximal tubular dysfunction compromises the body’s ability to excrete the dietary acid load as ammonium and metabolic acidosis occurs. In response to acidosis in the setting of decreased ammoniagenesis, an increase in excretion of titratable acid via phosphaturia has been observed. This has been described both with an increase in phosphaturic hormones, including PTH and FGF-23, but also has been described in their absence.
In CKD, increased circulating phosphate is believed to promote arterial calcification, contributing to cardiovascular events and death. Increased mobilization of calcium and phosphate from bone also has untoward implications for fracture risk. To date, the relationship between acidosis and phosphate metabolism has not been studied in large cohorts of human patients with CKD.

Proposed physiologic adaptations and consequences resulting from a high dietary acid load in the setting of CKD. Blue boxes represent physiologic responses and red boxes represent their potential adverse effects. Dashed lines represent projected clinical sequelae for which current evidence is indirect. Figure 2 from Scialla and Anderson, ACKD © National Kidney Foundation.
To elucidate the association of metabolic acidosis with levels of circulating phosphate and phosphaturia and the role of phosphaturic hormones, the authors reviewed records of 1,000 patients with CKD in the CRIC cohort who were randomly selected to have 24-hour urine collections at baseline. 20 were excluded due to having an alkaline urine pH. Each patient had values for PRAL, NAE, and serum bicarbonate level measured as exposure levels. Outcome variables included urine and serum phosphorus, urine calcium, carboxy-terminal FGF-23, and intact PTH concentrations.
Demographic, comorbidity, and other covariate data was broadly reflective of the CRIC cohort as a whole, which was deliberately constructed to be representative of the population of CKD patients in the United States, with a significant proportion of African Americans and about equal numbers of patients with and without diabetes.
After adjustment for patient characteristics, markers of kidney function, comorbidities, and diuretic use, Khairallah et al found that patients with higher quartiles of NAE and PRAL, as well as lower serum bicarbonate levels, had higher 24-hour urine phosphorus excretion. Patients with higher NAE and lower bicarbonate also had higher serum phosphorus levels, though this trend was not observed in patients with higher PRAL.
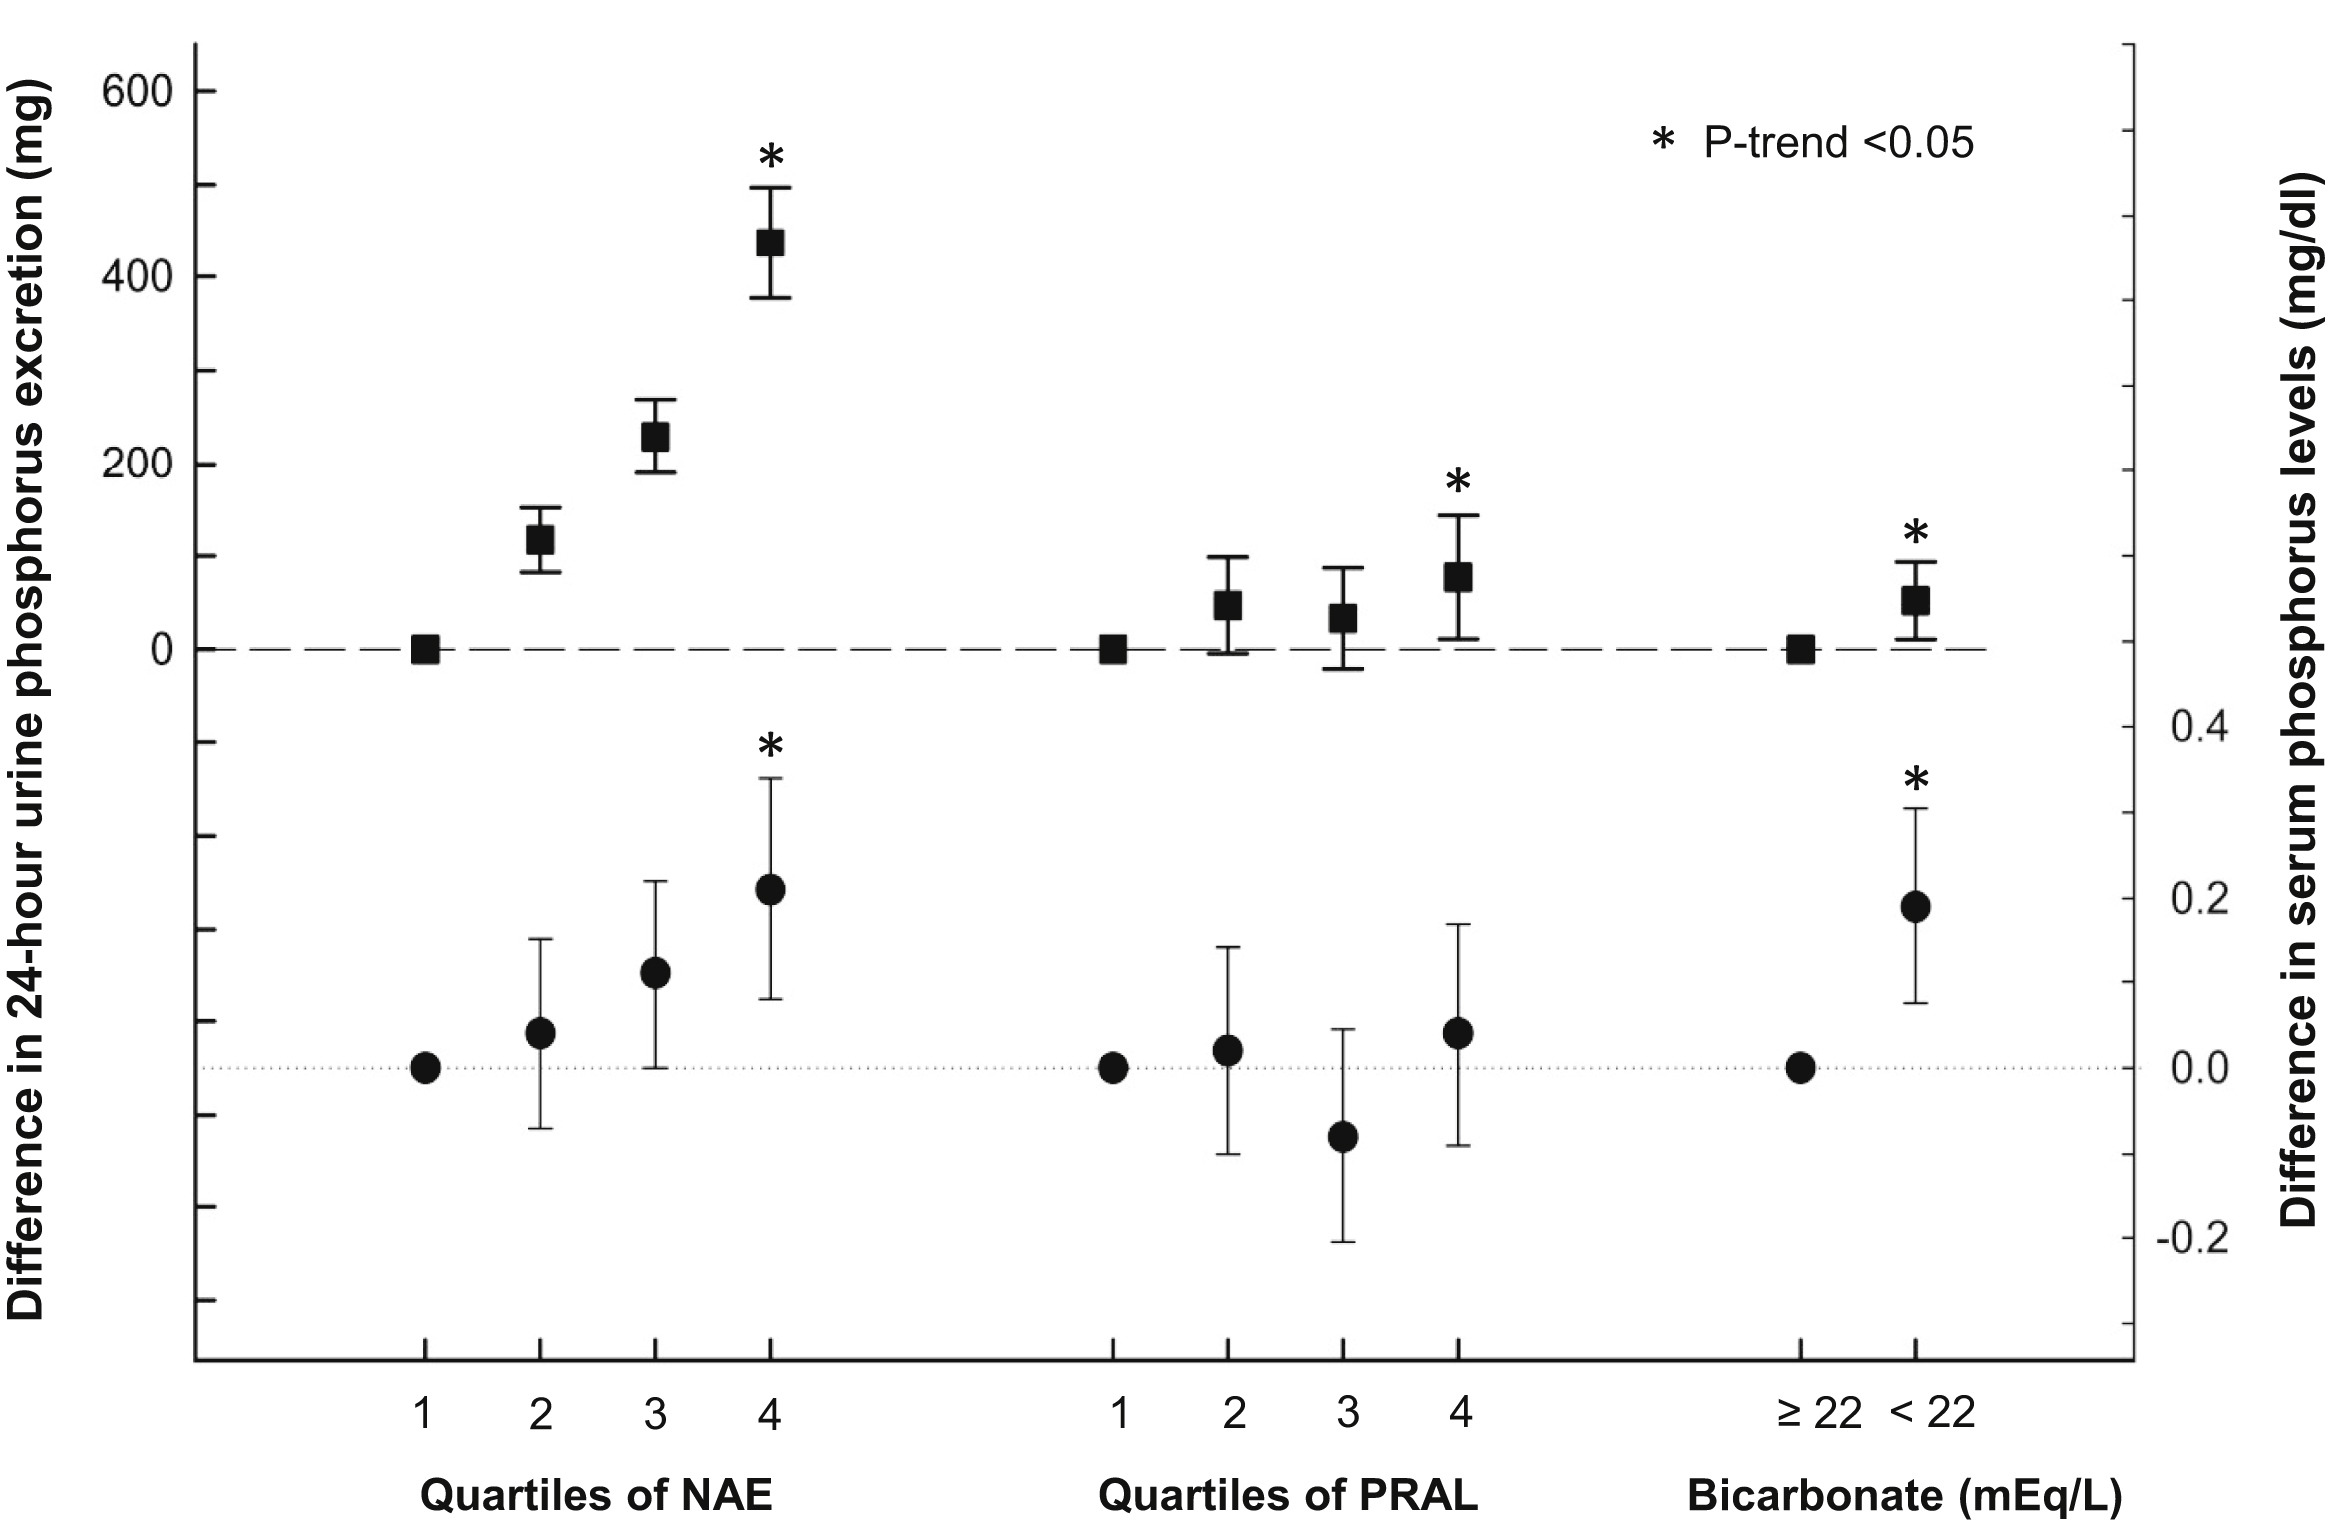
Adjusted absolute difference in mean 24-hour urine phosphorus excretion and serum phosphorus concentrations across quartiles of net acid excretion (NAE), quartiles of potential renal acid load (PRAL), and bicarbonate concentrations. Squares represent the difference between 24-hour urine phosphorus excretion and reference category. Circles represent the difference between serum phosphorus concentrations and reference category. Error bars represent 95% confidence intervals. Models are adjusted for age, sex, black versus nonblack race, estimated glomerular filtration rate, 24-hour urine albumin excretion, diabetes, cardiovascular disease, smoking, body mass index, diuretic use, and 24-hour urine creatinine excretion. *P trend < 0.05 from a continuous linear model. Figure 1 from Khairallah et al, AJKD © National Kidney Foundation.
This confirms what was expected based on prior studies, but begs the question of how this effect is mediated. To that end, the authors looked at results of PTH and FGF-23. In a fully adjusted model, no significant trend was observed for FGF-23 and PTH concentrations across quartiles of NAE or PRAL. PTH, but not FGF-23 concentrations, were significantly higher in patients with serum bicarbonate concentrations < 22 mEq/L.

Relative Difference in Geometric Mean of PTH and FGF-23 in Demographic- and Fully Adjusted Models According to Quartiles of Net Acid Excretion, Quartiles of PRAL, and Serum Bicarbonate. Table 2 from Khairallah et al, AJKD © National Kidney Foundation.
This would seem to suggest that the effect is mediated via increased phosphorus mobilization from storage sites promoting bone resorption directly rather than mediated by PTH or FGF-23. Indeed, 24-hour urine calcium excretion was significantly higher in higher quartiles of NAE, though this trend was not observed for PRAL or bicarbonate.
However, in secondary analysis, fractional excretion of phosphorus was observed to be higher in higher quartiles of NAE, but not PRAL or serum bicarbonate. This supports the hypothesis that the rise in circulating phosphorus and increased urinary phosphorus is mediated by increased action of phosphaturic hormones. The authors speculate that in the absence of a clear increase in circulating levels of phosphaturic hormones, the effect may be mediated by increased flux through phosphate transporters.

Adjusted difference in fractional excretion of phosphorus by acid load. Figure S2 from Khairallah et al, AJKD © National Kidney Foundation.
Here, the authors are careful to draw any firm conclusions due to the inherent limitations of observational data. Additionally, there are several other putative sources of the increased phosphorus, including mobilization from intracellular stores and increased absorption in the gut. They are also quick to note that, compared to in vitro studies, the extent of the acidosis in this cohort is likely much less, with only 18% of the total cohort having a serum bicarbonate level of less than 22 mEq/L. There was also no data available on pH, raising questions as to whether the cohort was truly acidemic.
Finally, given the potential statistical correlation of NAE and 24-hour urine phosphorus, the authors also analyzed urine ammonium and pH as alternate markers of acid excretion. They found that 24-hour urine phosphorus excretion was higher among those with higher quartiles of urine ammonium. Likewise, a similar trend was observed with fractional excretion of phosphorus.

Adjusted absolute difference in mean 24-hour urine phosphorus excretion across quartiles of urine pH and urine ammonium excretion. Diamonds represent the difference between 24-hour urine phosphorus excretion and reference category (quartile 1) across urine ammonium quartiles. Triangles represent the difference between 24-hour urine phosphorus excretion and reference category (quartile 4) across urine pH quartiles. Error bars represent 95% confidence intervals. Models are adjusted for age, sex, black versus nonblack race, estimated glomerular filtration rate, 24-hour urine albumin excretion, diabetes, cardiovascular disease, smoking, body mass index, diuretic use, and 24-hour urine creatinine excretion.*P trend < 0.05 from a continuous linear model. Figure 2 from Khairallah et al, AJKD © National Kidney Foundation.

Adjusted difference in fractional excretion of phosphorus by acid load. Figure S2 from Khairallah et al, AJKD © National Kidney Foundation.
Inevitably, the possibility of residual confounding based on extent of renal dysfunction may cloud the results of this observational study. Further trials are needed to elucidate the mechanism of increased circulating phosphorus and increased phosphaturia in the setting of metabolic acidosis in CKD.
Interestingly, the correlation of acid retention and phosphaturia had been elucidated by Lemann et al in the 1960s, albeit in healthy individuals. However, this is a unique and robust data set. It is the first large cross-sectional data describing the interplay between metabolic acidosis and phosphate metabolism. Moreover, the CRIC cohort represents a real-world population of Americans with CKD and the addition of dietary intake data to serum biomarkers and 24-hour urine samples adds an additional layer of physiologic rationale. This invites speculation about dietary acid load and base supplementation as potential therapeutic interventions. For the time being, though, we are left with the lesson that in CKD, the more acid you eat, the more phosphorus you excrete.
– Post prepared by Nathaniel Reisinger, AJKDBlog Contributor. Follow him @nephrothaniel.
To view the Khairallah et al article (subscription required), please visit AJKD.org.
Title: Acid Load and Phosphorus Homeostasis in CKD
Authors: P. Khairallah, T. Isakova, J. Asplin, L. Hamm, M. Dobre, M. Rahman, K. Sharma, M. Leonard, E. Miller III, B. Jaar, C. Brecklin, W. Yang, Xue Wang, H. Feldman, M. Wolf, J.J. Scialla, on behalf of the CRIC Study Investigators
DOI: 10.1053/j.ajkd.2017.04.022
Where do egg whites fit on the continuum?